WEATHER NOTES
Min Max Data - (All extreme data is read at 9am & thus is taken over a period of 24 hrs)
OBSERVATION
UNIT
RESOLUTION
DAY REPORTED ON
Max Air Temperature
(°C)
0.1
PREVIOUS
Min Air Temperature
(°C)
0.1
SAME
Max Humidity
(%)
0.1
SAME
Min Humidity
(%)
0.1
SAME
Max Dew-Point
(°C)
0.1
SAME
Min Dew-Point
(°C)
0.1
SAME
Max Wind Gust
(km/h)
0.1
SAME
Max Wind Gust Direction
(16 Points)
SAME
Wind Run Total
(km)
0.1
SAME
Min Wind Chill
(°C)
0.1
SAME
Max Heat Index
(°C)
0.1
PREVIOUS
Max Air Pressure
(hPa)
0.1
SAME
Min Air Pressure
(hPa)
0.1
SAME
Min Grass Temperature
(°C)
0.1
SAME
Rainfall
(mm)
0.2
SAME
Phenomena
(Observation)
SAME
~ t = Thunderstorm, s = Distant Thunderstorm, h = Hail, d = Dew, g = Fog & f = Frost
# I believe these are the official period of measurement for Min/Max data by the BoM in Australia.
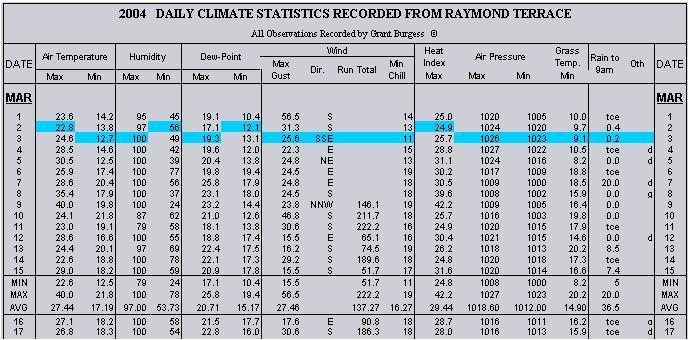
The tables below show data recorded over the same 24 hour period - see the blue boxes.
Till 31/12/2008
From 01/01/2009

FURTHER (Till 31/01/2012)
~ Humidity over 97% equals 100%, under 10% equals 5%
~ Wind gusts are unable to be measured under 4.3km/h
~ Heat Index is not calculated when the air temperature falls below 20°C, it equals the air temperature.
~ Air pressure is taken from station level (approx 8m ASL). Add 1hPa for sea level pressure.
FURTHER (From 01/02/2012)
~ Humidity limit values are no longer restricted
~ Wind gusts are unable to be measured under 0.5km/h accurately, thus are ignored
~ Heat Index is not calculated when the air temperature falls below 20°C, it equals the air temperature.
~ Air pressure is taken from station level (approx 8m ASL). Add 1hPa for sea level pressure.
9am & 3pm Data
OBSERVATION
UNIT
SPECIFICATIONS
Air Temperature
(°C)
Immediate
Humidity
(%)
Immediate
Dew-Point
(°C)
Immediate
Air Pressure
(hPa)
Immediate
Air Pressure Trend
from Weather station
Wind Gust
(km/h)
Max in previous 10mins
Wind Speed
(km/h)
Average in previous 10mins
Wind Direction
(16 Points)
Average in previous 10mins
Wind Chill
(°C)
Min in previous 10mins
Running Summaries
Current Monthly Report - Data averaged for the month so far. Where extreme average records are mentioned,
these are calculated on the data received so far. Records are officially recognised only after an official monthly
report has been released.